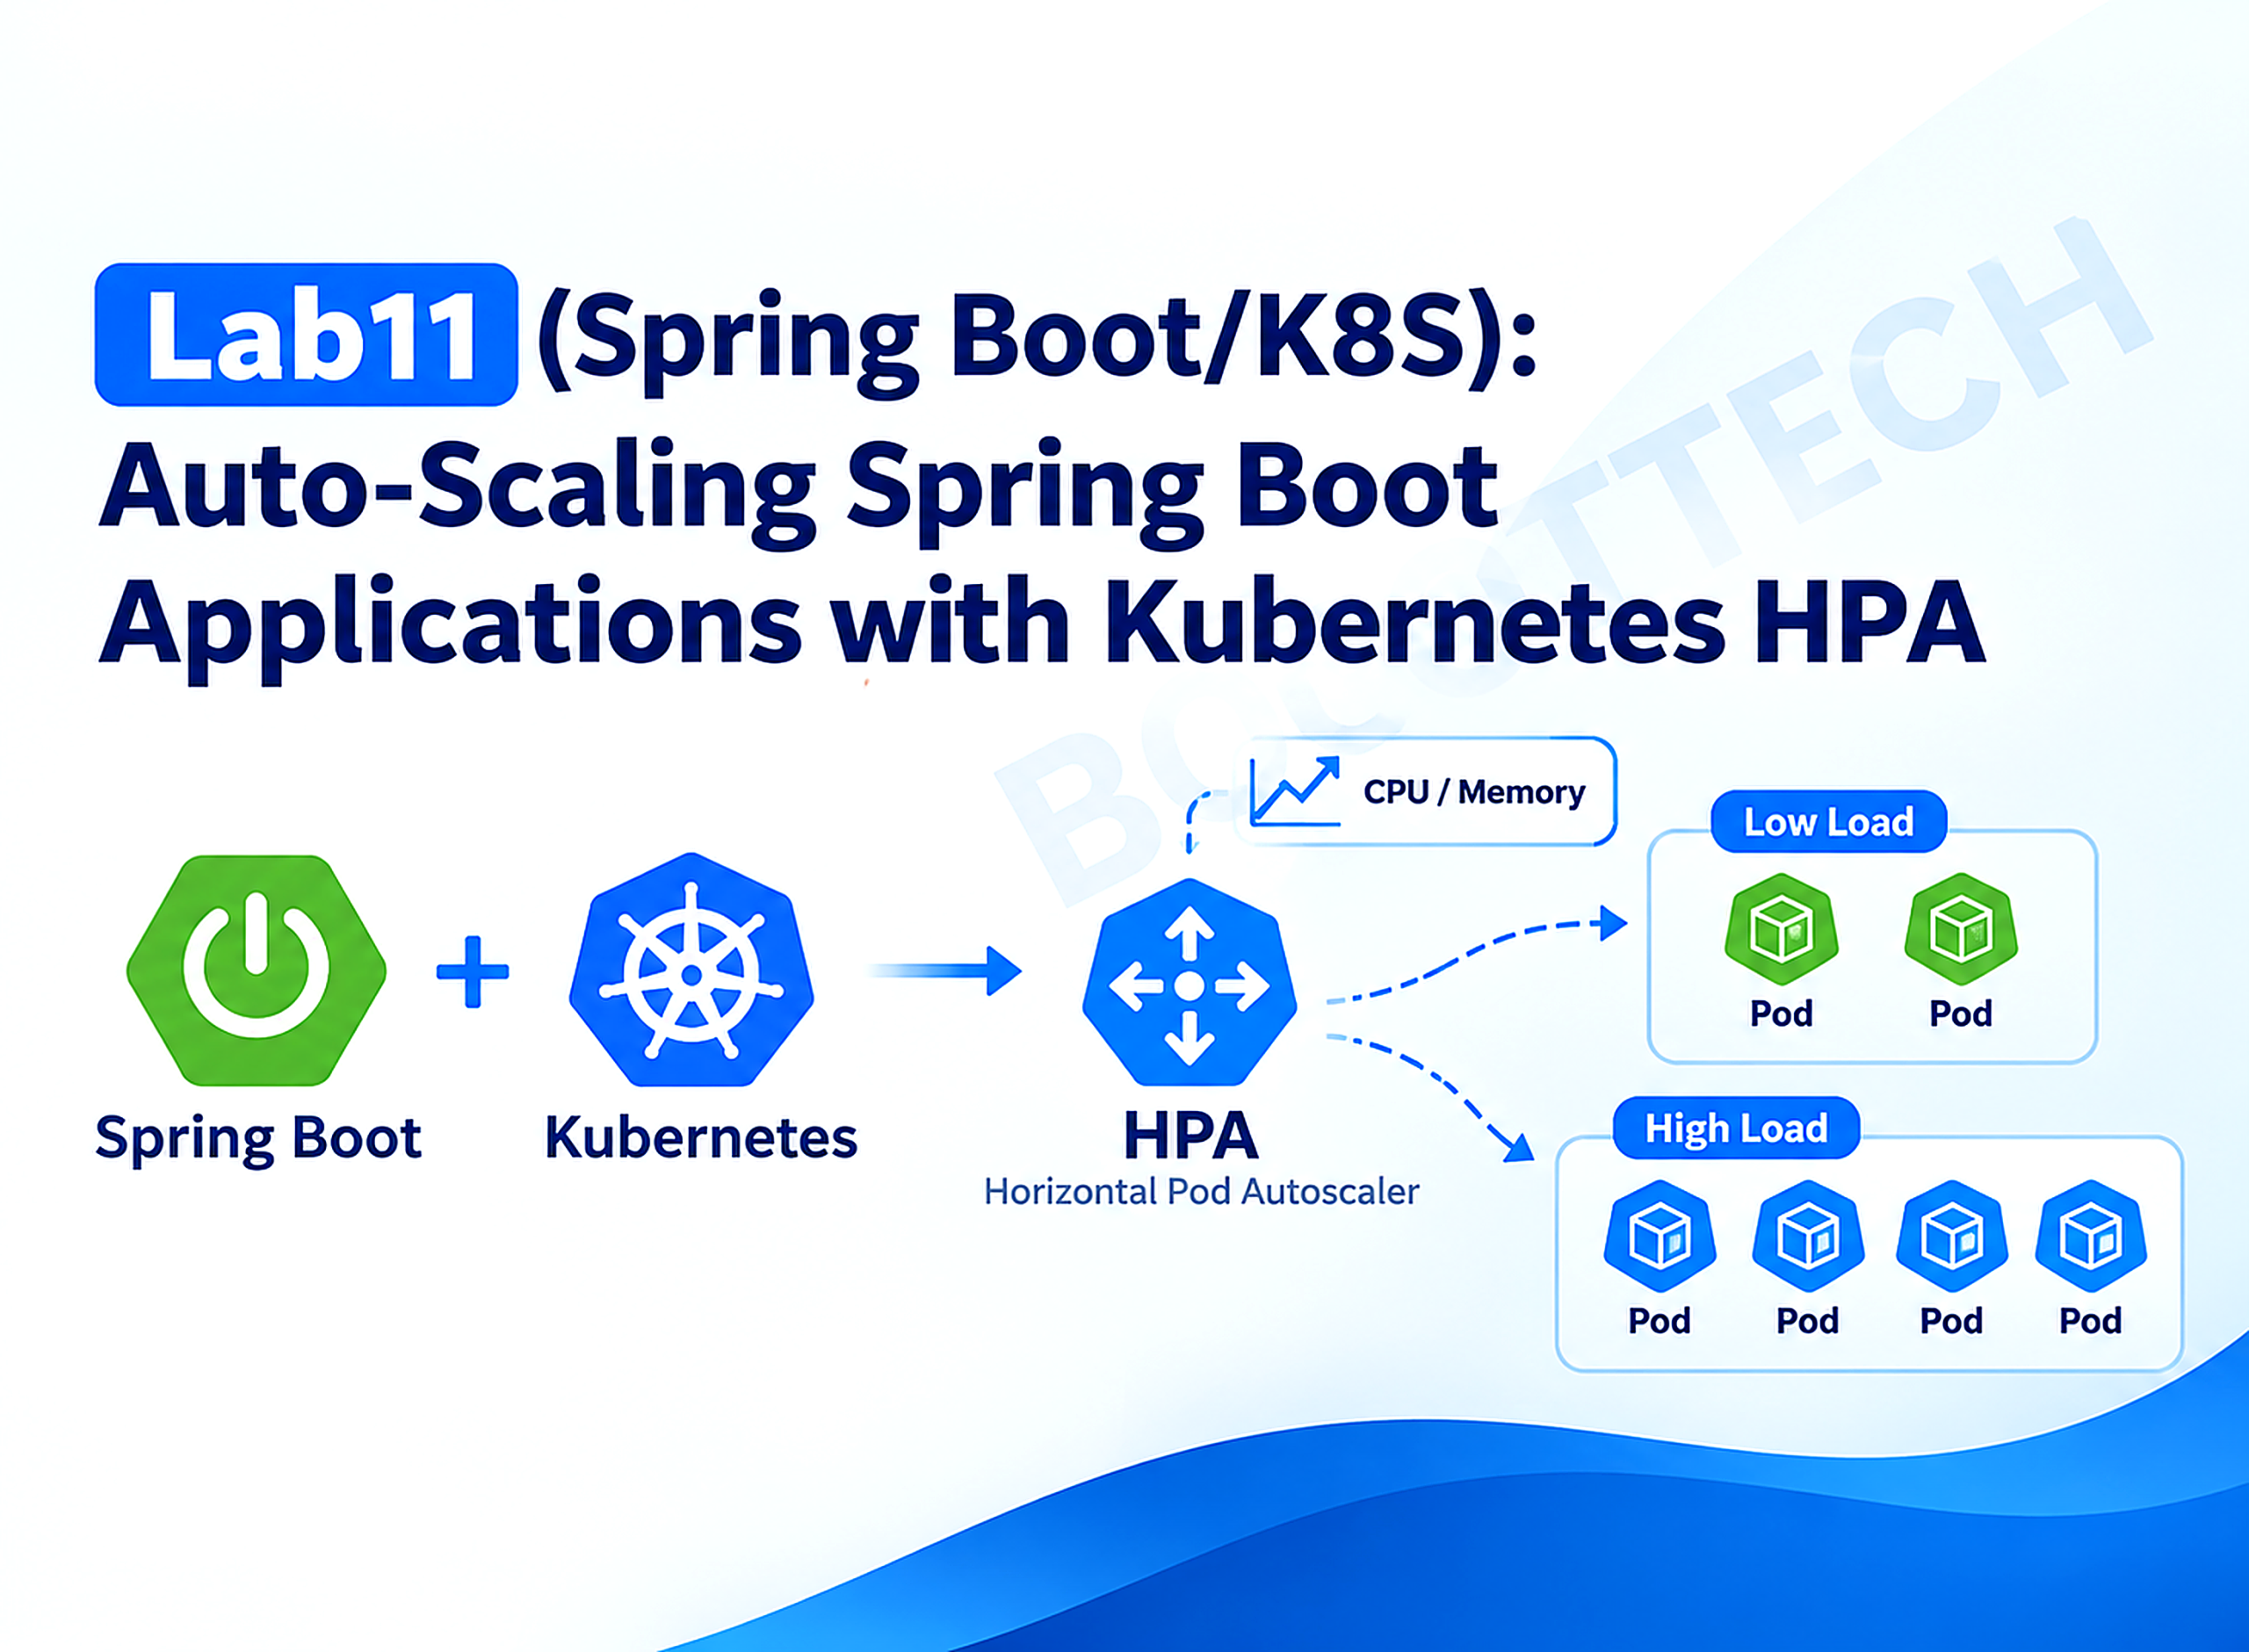
In this post, I’ll build a production-oriented HPA for a CPU-bound Spring Boot 3.3 service, configure autoscaling/v2, set up metrics-server, and test scale-out and scale-in on Minikube.
This series of stories shows how to use Kubernetes in the Spring ecosystem. We work with a Spring Boot API and Minikube to have a lightweight and fast development environment similar to production.
- Lab1 (Spring Boot/K8S): Deploy Spring Boot application on Kubernetes
- Lab2 (Spring Boot/K8S): Kubernetes health probes with Spring Boot
- Lab3 (Spring Boot/K8S): Mastering ConfigMaps in Kubernetes
- Lab4 (Spring Boot/K8S): Using Kubernetes Secrets in Spring Boot
- Lab5 (Spring Boot/K8S): Understanding Kubernetes Resources Management
- Lab6 (Spring Boot/K8S): Persistent Volumes in Kubernetes
- Lab7 (Spring Boot/K8S): Spring Batch on Kubernetes — Jobs and CronJobs
- Lab8 (Spring Boot/K8S): Deploy a Spring Boot application on Kubernetes using Helm Chart
- Lab9 (Spring Boot/K8S): Understanding Kubernetes DaemonSet
- Lab10 (Spring Boot/K8S): Frontend deployment with Angular 19 on Kubernetes
- 👉 Lab11 (Spring Boot/K8S): Auto-Scaling Spring Boot Applications with Kubernetes HPA
A replicas: 3 line in a Deployment manifest is a guess frozen at deploy time. Traffic doesn’t stay flat, so that guess is either too high — paying for idle pods around the clock — or too low, which means your service falls over the moment real load shows up. The Horizontal Pod Autoscaler (HPA) replaces the guess with a control loop: it watches a metric (CPU utilization by default), compares it against a target you set, and adjusts the replica count of a Deployment up or down to match.
This is Lab11 in the Spring Boot/K8S series. It builds directly on Lab5 (Kubernetes Resources Management) — HPA cannot compute a CPU percentage without the resources.requests.cpu value that lab introduces — and on Lab2 (Kubernetes Health Probes), since a pod that scales up but isn’t ready to receive traffic doesn’t help you. You’ll deploy a small Spring Boot service to Minikube, attach an HPA targeting 50% average CPU utilization, generate real load against it, and watch kubectl get hpa -w add and remove pods in real time.
Concept Overview
What HPA actually does
The HPA is a Kubernetes controller running a reconciliation loop, by default every 15 seconds (--horizontal-pod-autoscaler-sync-period). On each tick it:
- Reads the current metric value for every pod matched by the target Deployment’s selector — for a
Resourcemetric of typecpu, that value comes from the Metrics API (metrics.k8s.io), which is served by the metrics-server add-on, not by the core API server. - Averages that value across all pods.
- Computes a desired replica count.
- Patches the Deployment’s
spec.replicasif the desired count differs from the current one (subject tominReplicas/maxReplicasbounds and the stabilization windows discussed below).
The desired replica formula, straight from the Kubernetes source, is:
desiredReplicas = ceil(currentReplicas × (currentMetricValue / desiredMetricValue))If you have 2 replicas averaging 80% CPU against a 50% target: ceil(2 × (80/50)) = ceil(3.2) = 4 replicas. A built-in tolerance (10% by default, cluster-configurable via --horizontal-pod-autoscaler-tolerance) means the controller ignores small deviations around the target so it doesn’t scale for noise.
Why metrics-server is a separate moving part
The Kubernetes API server does not track CPU or memory usage itself. metrics-server is a lightweight, cluster-wide aggregator: it polls the kubelet’s Summary API on every node (itself sourced from cgroups, via cAdvisor) roughly every 15 seconds, and exposes the aggregated result through the metrics.k8s.io API group. HPA — and kubectl top pods — both read from that API. If metrics-server isn’t running, kubectl get hpa shows <unknown> under TARGETS and the controller can’t scale anything, no matter how correct your HPA manifest is. This is the single most common reason an HPA “does nothing” in a fresh cluster.
Utilization is requests-relative, not limits-relative
This trips up almost everyone the first time: “50% CPU utilization” means 50% of the pod’s requested CPU, not its limit. If a container requests 250m and is consuming 200m, that’s 80% utilization — even if its limit is 500m and it’s nowhere near being throttled. Get the request wrong (too high, too low) and the percentage the HPA reacts to is wrong too, even though the actual CPU consumption never changed. This is exactly why Lab5’s resource-sizing work is a hard prerequisite here, not just good practice.
What We’re Building
A minimal Spring Boot REST API with one deliberately CPU-heavy endpoint (/api/cpu/burn, a trial-division prime counter) that lets us generate real, sustained CPU load on demand — no synthetic metric needed. We deploy it with an explicit resources.requests.cpu, attach an HPA targeting 50% average CPU utilization across 2–10 replicas, then hammer it with concurrent requests from an in-cluster load generator and watch the replica count climb, plateau, and — after the load stops — scale back down.
                    ┌───────────────┐   polls kubelet    ┌──────────────┐
                    │ metrics-server│ ◀────every 15s──── │  kubelet(s)  │
                    └──────┬────────┘                    └──────────────┘
                           │ metrics.k8s.io
                           ▼
┌──────────────┐   reads   ┌──────────────────┐   patches replicas    ┌──────────────┐
│ load-generator│ ────────▶│  HPA controller   │ ────────────────────▶│  Deployment  │
│ (busybox pod) │  traffic  │ (hpa-demo, 50%CPU)│                     │  hpa-demo    │
└──────────────┘           └──────────────────┘                       └──────┬───────┘
                                                                              │ owns
                                                                              ▼
                                                                    ┌──────────────────┐
                                                                    │  Pods (1 → N)    │
                                                                    │  hpa-demo-xxxxx  │
                                                                    └──────────────────┘
Implementation
Let’s create a simple Spring Boot project from start.spring.io,
Step 1 — Project setup
<parent>
    <groupId>org.springframework.boot</groupId>
    <artifactId>spring-boot-starter-parent</artifactId>
    <version>3.3.5</version>
    <relativePath/>
</parent>

<properties>
    <java.version>21</java.version>
</properties>

<dependencies>
    <dependency>
        <groupId>org.springframework.boot</groupId>
        <artifactId>spring-boot-starter-web</artifactId>
    </dependency>
    <dependency>
        <groupId>org.springframework.boot</groupId>
        <artifactId>spring-boot-starter-actuator</artifactId>
    </dependency>
    <dependency>
        <groupId>org.springframework.boot</groupId>
        <artifactId>spring-boot-starter-test</artifactId>
        <scope>test</scope>
    </dependency>
</dependencies>
spring-boot-starter-actuator is not optional here — it’s what backs the /actuator/health/liveness and /actuator/health/readiness probes the Deployment relies on, and readiness is exactly what stops the HPA’s newly-created pods from receiving traffic before the JVM has finished starting up.
Step 2 — The CPU-bound workload
PrimeWorkloadService counts primes below a bound using plain trial division — deliberately unoptimized, since the point is to burn CPU cycles predictably, not to compute primes efficiently:
package com.bootlabs.hpademo.service;

import com.bootlabs.hpademo.dto.LoadResponse;
import org.springframework.stereotype.Service;

@Service
public class PrimeWorkloadService {

    private final String podName = System.getenv().getOrDefault("POD_NAME", "local");

    public LoadResponse countPrimesBelow(int upperBound) {
        long start = System.nanoTime();
        int count = 0;
        for (int candidate = 2; candidate < upperBound; candidate++) {
            if (isPrime(candidate)) {
                count++;
            }
        }
        long elapsedMs = (System.nanoTime() - start) / 1_000_000;
        return new LoadResponse(podName, upperBound, count, elapsedMs);
    }

    public String podName() {
        return podName;
    }

    private boolean isPrime(int number) {
        if (number < 2) {
            return false;
        }
        for (int divisor = 2; (long) divisor * divisor <= number; divisor++) {
            if (number % divisor == 0) {
                return false;
            }
        }
        return true;
    }
}
podName is read from a POD_NAME environment variable, not from InetAddress.getLocalHost() or the OS-level HOSTNAME variable. Kubernetes sets the container’s kernel hostname to the pod name, but that’s only reliably exposed as a process environment variable if the entrypoint runs through a shell that exports it (like bash). Our container’s ENTRYPOINT is the exec-form ["java", "-jar", "app.jar"] — no shell in between — so nothing auto-populates HOSTNAME. The Downward API sidesteps that entirely by injecting the pod’s own metadata as an env var at the kubelet level, which is what Step 6’s Deployment manifest does. This also means during a load test you can see request handling literally spread across different pod names as the HPA scales — this is the same instrumentation trick you’d reach for in production to attribute a slow request to a specific pod.
LoadResponse is a small immutable record:
package com.bootlabs.hpademo.dto;

public record LoadResponse(String pod, int upperBound, int primesFound, long elapsedMs) {
}
Step 3 — Controller
package com.bootlabs.hpademo.controller;

import com.bootlabs.hpademo.dto.LoadResponse;
import com.bootlabs.hpademo.service.PrimeWorkloadService;
import org.springframework.web.bind.annotation.GetMapping;
import org.springframework.web.bind.annotation.RequestParam;
import org.springframework.web.bind.annotation.RestController;

@RestController
public class LoadController {

    private static final int MAX_UPPER_BOUND = 2_000_000;
    private static final int MIN_UPPER_BOUND = 1_000;

    private final PrimeWorkloadService workloadService;

    public LoadController(PrimeWorkloadService workloadService) {
        this.workloadService = workloadService;
    }

    @GetMapping("/api/cpu/burn")
    public LoadResponse burnCpu(@RequestParam(name = "upperBound", defaultValue = "200000") int upperBound) {
        int bound = Math.min(Math.max(upperBound, MIN_UPPER_BOUND), MAX_UPPER_BOUND);
        return workloadService.countPrimesBelow(bound);
    }

    @GetMapping("/api/status")
    public PodStatus status() {
        return new PodStatus(workloadService.podName());
    }

    public record PodStatus(String pod) {
    }
}
upperBound is clamped on both ends. Without the ceiling, a single malicious or misconfigured request (upperBound=2000000000) could pin a CPU core for tens of seconds on its own, turning a load test into a self-inflicted denial of service — the same reasoning as validating a page-size parameter on a paginated endpoint, just for compute instead of rows.
Step 4 — Actuator configuration
server:
  port: 8080

spring:
  application:
    name: hpa-demo

management:
  endpoints:
    web:
      exposure:
        include: health,info
  endpoint:
    health:
      probes:
        enabled: true
  health:
    livenessstate:
      enabled: true
    readinessstate:
      enabled: true
management.endpoint.health.probes.enabled: true splits /actuator/health into /actuator/health/liveness and /actuator/health/readiness — Spring Boot’s “health groups” feature, aligned with the two Kubernetes probe types. Liveness answers “is the JVM alive,” readiness answers “can this pod accept traffic right now.” Pointing both probes at the same generic /actuator/health endpoint (a common shortcut) means a slow-starting dependency can make Kubernetes think the whole pod is unhealthy and restart it, rather than just holding it out of the Service’s endpoint list until it’s ready — see Lab2 for the full breakdown.
Step 5 — Dockerfile
FROM maven:3.9.9-eclipse-temurin-21 AS build
WORKDIR /app
COPY pom.xml .
RUN mvn -B dependency:go-offline
COPY src ./src
RUN mvn -B clean package -DskipTests

FROM eclipse-temurin:21-jre-alpine
RUN addgroup -S spring && adduser -S spring -G spring
WORKDIR /app
COPY --from=build /app/target/*.jar app.jar
USER spring:spring
EXPOSE 8080
ENTRYPOINT ["java", "-jar", "app.jar"]
A multi-stage build keeps the final image to a JRE plus one jar — no Maven, no source tree, no build cache — and running as a non-root spring user means a container escape doesn’t hand an attacker root on the node.
For a local sanity check before touching Kubernetes at all:
services:
  hpa-demo:
    build: .
    ports:
      - "8080:8080"
    environment:
      POD_NAME: local-compose
docker compose up --build
curl "http://localhost:8080/api/cpu/burn?upperBound=200000"
# {"pod":"local-compose","upperBound":200000,"primesFound":17984,"elapsedMs":38}Step 6 — Deployment with resource requests
This is the manifest that makes HPA possible in the first place:
apiVersion: apps/v1
kind: Deployment
metadata:
  name: hpa-demo
  labels:
    app: hpa-demo
spec:
  replicas: 1
  selector:
    matchLabels:
      app: hpa-demo
  template:
    metadata:
      labels:
        app: hpa-demo
    spec:
      containers:
        - name: hpa-demo
          image: hpa-demo:1.0.0
          imagePullPolicy: IfNotPresent
          ports:
            - containerPort: 8080
          env:
            - name: POD_NAME
              valueFrom:
                fieldRef:
                  fieldPath: metadata.name
          resources:
            requests:
              cpu: "250m"
              memory: "256Mi"
            limits:
              cpu: "500m"
              memory: "512Mi"
          readinessProbe:
            httpGet:
              path: /actuator/health/readiness
              port: 8080
            initialDelaySeconds: 10
            periodSeconds: 5
          livenessProbe:
            httpGet:
              path: /actuator/health/liveness
              port: 8080
            initialDelaySeconds: 20
            periodSeconds: 10
Every field here earns its place for HPA specifically, not just as general good practice:
resources.requests.cpu: "250m"is the denominator in every utilization calculation the HPA will make against this pod. No request, no percentage, no scaling — full stop.resources.limits.cpu: "500m"caps how much a single pod can absorb before the kernel throttles it. Set it too close to the request and pods hit the CPU limit and get throttled before the HPA even gets a chance to add a new one — the two need headroom between them, not to be equal.readinessProbeis what stops a freshly scaled-up pod from taking traffic mid-JVM-startup. A pod that’sRunningbut not yetReadyis excluded from the Service’s endpoints, so the existing pods keep absorbing load until the new one is actually warm.
Step 7 — Service and HPA
apiVersion: v1
kind: Service
metadata:
  name: hpa-demo
spec:
  selector:
    app: hpa-demo
  ports:
    - port: 80
      targetPort: 8080
  type: ClusterIP
apiVersion: autoscaling/v2
kind: HorizontalPodAutoscaler
metadata:
name: hpa-demo
spec:
scaleTargetRef:
apiVersion: apps/v1
kind: Deployment
name: hpa-demo
minReplicas: 2
maxReplicas: 10
metrics:
- type: Resource
resource:
name: cpu
target:
type: Utilization
averageUtilization: 50
behavior:
scaleUp:
stabilizationWindowSeconds: 0
policies:
- type: Pods
value: 2
periodSeconds: 30
scaleDown:
stabilizationWindowSeconds: 60
policies:
- type: Pods
value: 1
periodSeconds: 60Use autoscaling/v2, not autoscaling/v1 — v1 only supports the single implicit CPU-utilization metric and has no behavior block at all. v2 has been the stable API since Kubernetes 1.23 and is what every current cluster ships; there’s no reason to reach for v1 on a new manifest.
The behavior block is the difference between a demo that scales cleanly and one that flaps. scaleUp.stabilizationWindowSeconds: 0 means react immediately to a spike — waiting to add capacity is rarely what you want under real load. scaleDown.stabilizationWindowSeconds: 60 means the controller looks at the highest recommended replica count over the last 60 seconds before scaling down, not the instantaneous one, so a brief dip between two load bursts doesn’t tear down a pod you’ll need again in ten seconds. The default scale-down stabilization is actually 300 seconds (5 minutes) — 60 is set here only to keep the tutorial’s feedback loop fast; a production value closer to the default is usually the safer choice (see Common Pitfalls).
Step 8 — Deploy to Minikube and enable metrics-server
minikube start --cpus=4 --memory=8192

eval $(minikube docker-env)
docker build -t hpa-demo:1.0.0 .

# Enable the metrics pipeline HPA depends on
minikube addons enable metrics-server
Minikube’s metrics-server addon is pre-patched to tolerate the cluster’s self-signed kubelet certificates, so no extra --kubelet-insecure-tls flag is needed — that flag is required on a vanilla metrics-server install on a real cluster, but not here. It takes roughly a minute after enabling for the first metrics to become available:
kubectl apply -f k8s/deployment.yaml
kubectl apply -f k8s/service.yaml
kubectl apply -f k8s/hpa.yaml

kubectl get hpa hpa-demo -w
If TARGETS stays at <unknown> for more than a minute or two, metrics-server isn’t reporting yet — check kubectl top pods directly before assuming the HPA manifest itself is wrong.
Testing
Generating load
The most portable way to load-test a ClusterIP service — independent of your Minikube network driver — is an in-cluster pod hammering the Service’s internal DNS name:
kubectl run load-generator --image=busybox:1.36 --restart=Never -it --rm -- /bin/sh -c \
  "while true; do wget -q -O- http://hpa-demo.default.svc.cluster.local/api/cpu/burn?upperBound=800000; done"
For higher, more realistic concurrency from outside the cluster, use kubectl port-forward with a proper HTTP load tool instead:
kubectl port-forward svc/hpa-demo 8080:80 &
hey -z 3m -c 20 "http://localhost:8080/api/cpu/burn?upperBound=800000"
upperBound=800000 is chosen deliberately: at that size, a single request keeps one CPU core busy for roughly 150–300ms on typical Minikube VM sizing — enough to sustain visible CPU utilization under moderate concurrency, without any single request timing out the client.
Watching it scale
In a second terminal, watch both the HPA’s view and the actual pod count:
kubectl get hpa hpa-demo -w
kubectl get pods -l app=hpa-demo -w
Once the load generator is stopped, keep watching — the replica count won’t drop instantly. It waits out scaleDown.stabilizationWindowSeconds, then removes pods according to the scaleDown.policies rate limit (1 pod per 60s here), not all at once.
You can also inspect the controller’s own reasoning directly:
kubectl describe hpa hpa-demo

Unit and slice tests
PrimeWorkloadService is a plain unit test — no Spring context needed:
package com.bootlabs.hpademo.service;

import com.bootlabs.hpademo.dto.LoadResponse;
import org.junit.jupiter.api.Test;

import static org.assertj.core.api.Assertions.assertThat;

class PrimeWorkloadServiceTest {

    private final PrimeWorkloadService service = new PrimeWorkloadService();

    @Test
    void countsKnownNumberOfPrimesBelowBound() {
        LoadResponse response = service.countPrimesBelow(100);

        assertThat(response.primesFound()).isEqualTo(25);
        assertThat(response.upperBound()).isEqualTo(100);
        assertThat(response.elapsedMs()).isGreaterThanOrEqualTo(0);
    }

    @Test
    void returnsZeroPrimesBelowTwo() {
        LoadResponse response = service.countPrimesBelow(2);

        assertThat(response.primesFound()).isZero();
    }
}
And LoadController gets a @WebMvcTest slice, with the service mocked so the test only exercises parameter binding and the clamping logic:
package com.bootlabs.hpademo.controller;

import com.bootlabs.hpademo.dto.LoadResponse;
import com.bootlabs.hpademo.service.PrimeWorkloadService;
import org.junit.jupiter.api.Test;
import org.springframework.beans.factory.annotation.Autowired;
import org.springframework.boot.test.autoconfigure.web.servlet.WebMvcTest;
import org.springframework.boot.test.mock.mockito.MockBean;
import org.springframework.test.web.servlet.MockMvc;

import static org.mockito.ArgumentMatchers.eq;
import static org.mockito.BDDMockito.given;
import static org.springframework.test.web.servlet.request.MockMvcRequestBuilders.get;
import static org.springframework.test.web.servlet.result.MockMvcResultMatchers.jsonPath;
import static org.springframework.test.web.servlet.result.MockMvcResultMatchers.status;

@WebMvcTest(LoadController.class)
class LoadControllerTest {

    @Autowired
    private MockMvc mockMvc;

    @MockBean
    private PrimeWorkloadService workloadService;

    @Test
    void clampsUpperBoundBelowConfiguredMinimum() throws Exception {
        given(workloadService.countPrimesBelow(eq(1_000)))
                .willReturn(new LoadResponse("pod-a", 1_000, 168, 3));

        mockMvc.perform(get("/api/cpu/burn").param("upperBound", "10"))
                .andExpect(status().isOk())
                .andExpect(jsonPath("$.upperBound").value(1_000))
                .andExpect(jsonPath("$.pod").value("pod-a"));
    }
}
The clamping test is the one worth keeping even after the tutorial: it’s the regression test that would catch someone “simplifying” the controller by removing the Math.min/Math.max guard and reopening the self-DoS risk described in Step 3.
Edge cases worth adding beyond what’s shown here: upperBound above MAX_UPPER_BOUND (should clamp down, not error), a negative value, and — at the manifest level — applying the HPA before the Deployment exists (scaleTargetRef resolution failure, visible in kubectl describe hpa events).
Performance Considerations
The metrics pipeline has real latency, and HPA inherits all of it. metrics-server polls kubelets roughly every 15 seconds, and the HPA controller’s own sync loop runs every 15 seconds by default. In the worst case, a load spike can take close to 30–45 seconds to translate into a scaling decision, plus however long a new pod takes to pull its image, start the JVM, and pass its readiness probe. For a Spring Boot app with a 5–10 second cold start, budget 45–90 seconds from “traffic spikes” to “new pod is actually serving requests.” If your traffic pattern spikes faster than that, HPA alone won’t save you — see Alternative Approaches for minReplicas and pre-warming strategies.
JVM startup time is the real bottleneck, not container scheduling. Kubernetes can schedule and start a new pod’s container in a few seconds; a Spring Boot application on a standard (non-native) JVM typically needs several more seconds beyond that to reach a ready state. This is why minReplicas should never be 1 for a latency-sensitive service — see Common Pitfalls.
CPU-based scaling is a poor fit for I/O-bound workloads. A service that spends most of its time waiting on a database or downstream HTTP call can be saturated on concurrent requests while its CPU utilization stays low — HPA looking at CPU alone won’t scale it, because the metric it’s watching never crosses the threshold. This demo’s /api/cpu/burn endpoint is intentionally CPU-bound so CPU-based scaling is the right tool; a typical CRUD endpoint usually isn’t, and needs either a request-rate custom metric or autoscaling.k8s.io‘s memory metric depending on the actual bottleneck.
averageUtilization: 50 leaves real headroom, and that’s the point. Targeting 90% leaves almost no buffer for the 45–90 second scale-up latency above — by the time new pods are ready, existing ones may already be CPU-starved and degrading latency for users. 50% is a reasonable starting point; the right number depends on how spiky your traffic actually is and how long your pods take to become ready.
Common Pitfalls
- Deploying an HPA without a CPU request on the container. The HPA manifest applies fine —
kubectl applywon’t complain — butkubectl get hpashows<unknown>underTARGETSforever, because there’s no denominator for the utilization percentage. This is the single most common “why isn’t my HPA doing anything” support question. - Forgetting to enable
metrics-server. Same symptom as above (<unknown>targets), different cause. Always checkkubectl top podsfirst — if that command itself fails or hangs, the problem is the metrics pipeline, not your HPA manifest. - Setting
minReplicas: 1for anything user-facing. With one replica, every deployment, every crashed pod, and every scale-down-then-spike cycle produces a visible request failure window while Kubernetes starts a replacement.minReplicas: 2(or higher) means there’s always a second pod absorbing traffic while the first restarts — cheap insurance against the JVM startup latency discussed above. - Tight requests/limits ratio causing throttling before scale-up kicks in. If
requests.cpuandlimits.cpuare set close together (or equal), a pod under load hits its CPU limit and gets throttled by the kernel’s CFS bandwidth controller almost immediately — long before the HPA’s next 15-second sync tick has a chance to add capacity. Throttled latency is often worse than the brief overload the HPA would otherwise absorb. - No
PodDisruptionBudgetduring voluntary disruptions. HPA scaling down and a node drain (upgrade, autoscaler consolidation) can both remove pods at the same time. Without aPodDisruptionBudgetsettingminAvailable, nothing stops both events from taking your last healthy pod down simultaneously. - Scaling on a metric the workload doesn’t actually correlate with. CPU-based HPA on a queue-consuming worker, or on an endpoint that’s mostly waiting on a slow downstream call, produces a controller that watches a flat line and never reacts to the actual bottleneck. Match the metric to the workload’s real constraint, not to whatever’s easiest to wire up.
- Testing HPA behavior with a load tool that itself becomes the bottleneck. A single-threaded
curlloop or an underpoweredhey -c 2won’t generate enough sustained concurrent CPU pressure to cross 50% utilization on more than one pod — you’ll conclude the HPA “isn’t working” when it’s actually the load generator that’s undersized. Watchkubectl top podson the load-generator itself as a sanity check.
Key Takeaways
- HPA cannot compute anything without
resources.requests.cpuon the container — that field is the denominator of every utilization percentage it calculates. - The metrics pipeline (
metrics-server→ HPA controller) has real latency on the order of tens of seconds;minReplicasand readiness probes, not a lower target percentage, are what actually protect you during that window. - Match the scaling metric to the workload’s real bottleneck — CPU-based HPA is the right default for compute-bound services, but a poor fit for I/O-bound ones.
The complete source code is available on GitHub.
Support me through GitHub Sponsors.
Thank you for Reading !! See you in the next post.
References
- Kubernetes Documentation — Horizontal Pod Autoscaling
- Kubernetes Documentation — HPA Walkthrough
- Kubernetes Documentation — Downward API
- metrics-server — GitHub
- KEDA — Kubernetes Event-driven Autoscaling
- Kubernetes Documentation — Vertical Pod Autoscaler
- Spring Boot Documentation — Kubernetes Probes
- Lab5 (Spring Boot/K8S) — Understanding Kubernetes Resources Management
- Lab2 (Spring Boot/K8S) — Kubernetes Health Probes with Spring Boot